¶ Analysis
The Altion Voltage Regulator includes a powerful on-device Analysis tool, accessible directly via its web interface. This feature is designed to provide in-depth historical data visualization and diagnostics, allowing you to understand long-term performance trends, troubleshoot past events, and review system configuration changes over time.
To access the Analysis tool, open your web browser and navigate to regulator.local/ (or the IP address of your regulator) and click the analysis tab.
¶ Exploring the Analysis Interface
The Analysis tool provides a comprehensive interface for data exploration. At the top of the page, you'll see a System Status indicator (e.g., "System Healthy & Data Up-to-Date") providing an at-a-glance view of the regulator's operational state. The main interface is organized around the "Chart & Controls" area, the interactive data chart, and detailed data tabs below the chart.
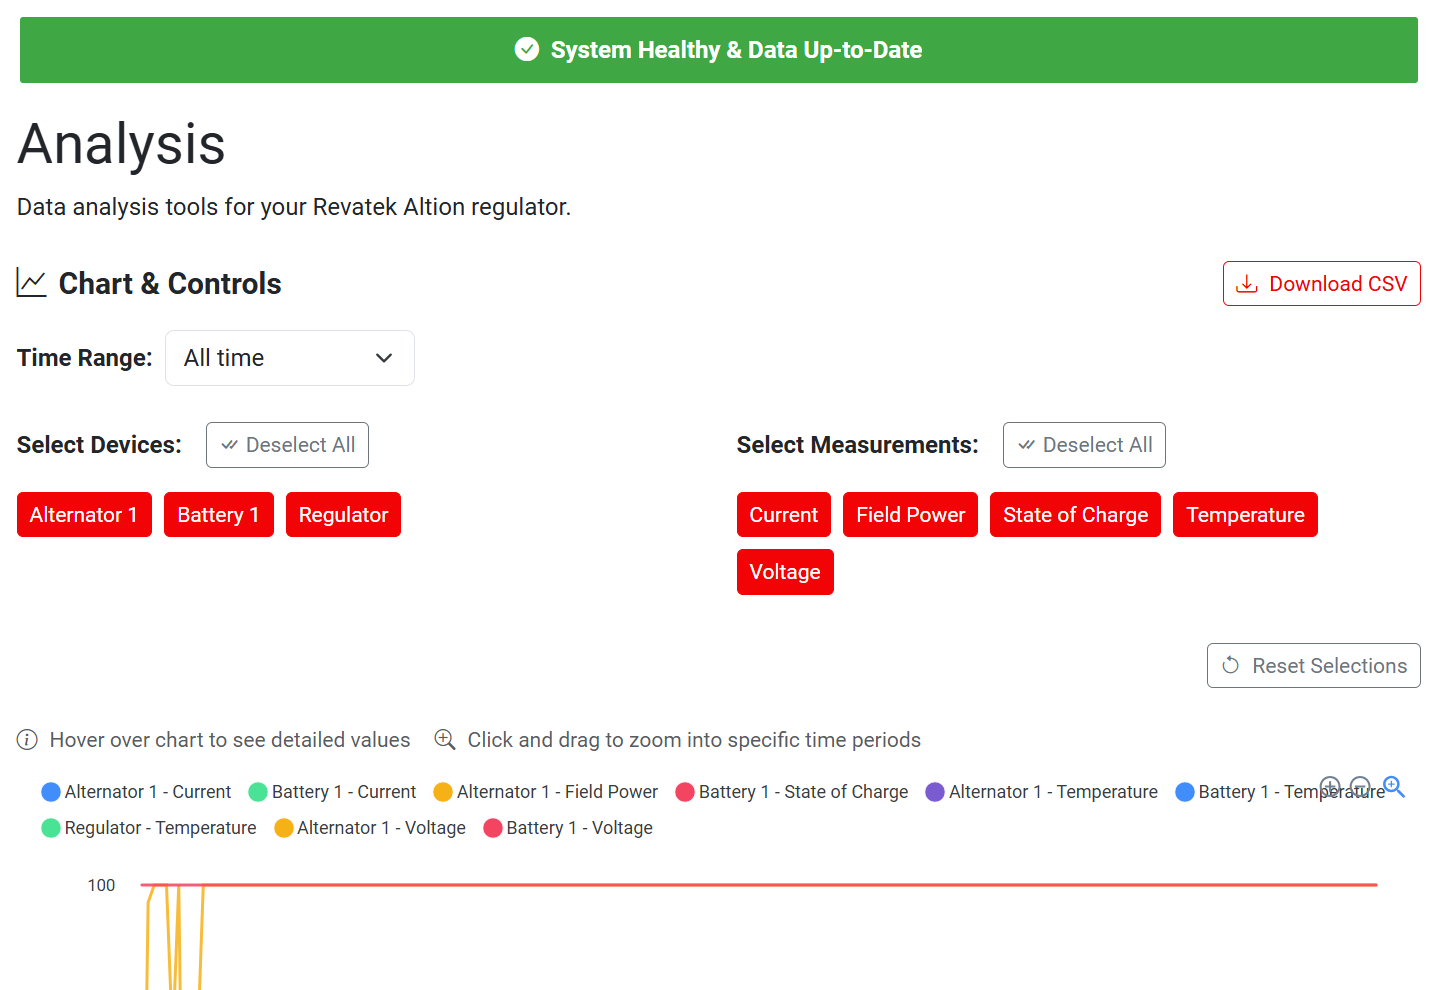
The main Analysis tool interface, showing system status, controls, chart area, and data tabs.
¶ Chart & Controls
This section is your main control panel for defining what data you want to see on the chart.
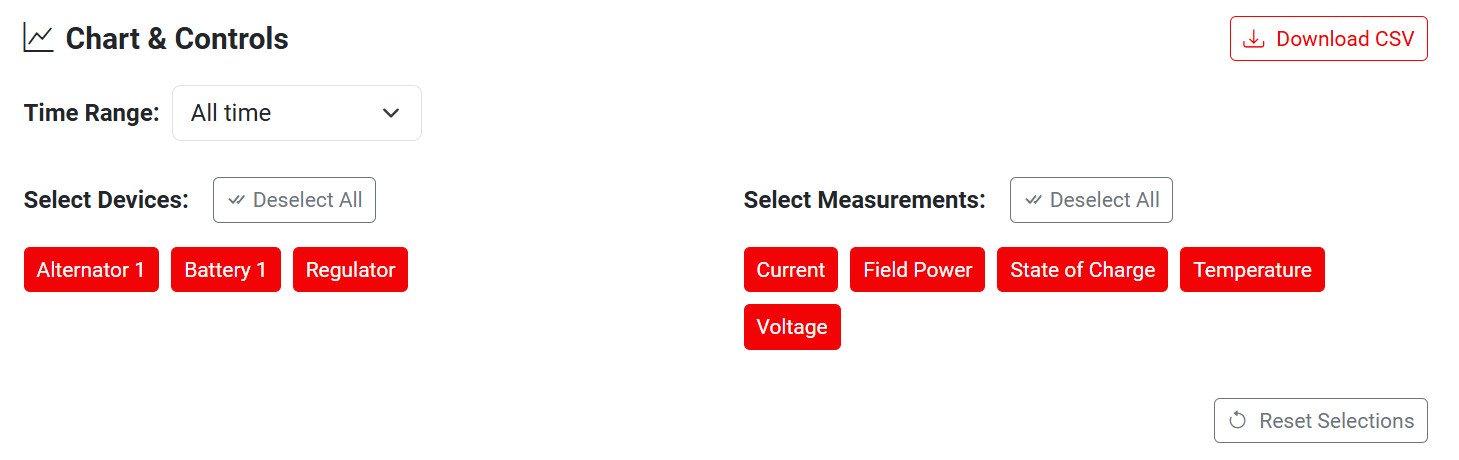
Use the Chart & Controls to select your desired time range, devices, and measurements.
- Time Range: Select the period for which you want to view data. Options include predefined ranges (e.g., "Last Hour," "Last 24 Hours," "All time") or custom ranges created by zooming on the chart.
- Select Devices: Filter data by specific components in your system.
- Available devices typically include "Alternator 1," "Battery 1," and the "Regulator" itself, presented as clickable buttons.
- A "✓ Deselect All" button allows you to quickly toggle the selection of all available devices.
- Select Measurements: Choose the specific data parameters you wish to analyze for the selected devices.
- Common measurements include: Current, Field Power, State of Charge, Temperature, and Voltage, also presented as clickable buttons.
- A "✓ Deselect All" button allows you to quickly toggle the selection of all available measurements.
- Download CSV: This prominent button allows you to export the raw data currently displayed in the chart to a CSV (Comma Separated Values) file. This is useful for offline analysis, record-keeping, or sharing with support personnel.
- Reset Selections: Clears all your current device and measurement selections and reverts the chart to its default view.
¶ Interactive Data Chart
The large chart prominently displayed is where your selected data is visualized over time. The legend above the chart helps identify the data series.
- Hover for Details: Move your mouse cursor over any data line on the chart. A tooltip will appear showing the precise value, timestamp, and charge stage (if applicable) for multiple data points at that specific time, making it easy to inspect exact readings.
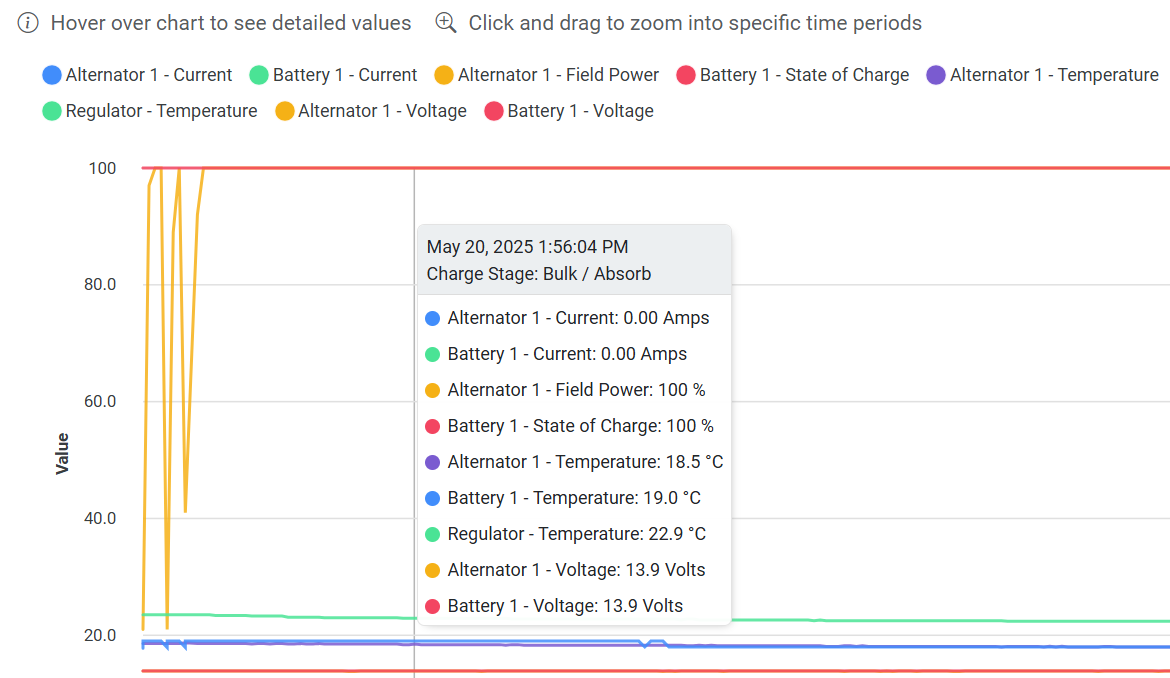
Hover over the chart to see a detailed tooltip with specific values and timestamps.
- Zoom Functionality: Click and drag horizontally across a section of the chart to select a region. The chart will then zoom into that specific time period, and the "Time Range" selector will automatically update to reflect your custom zoomed view. This enables focused investigation of particular events. The selected region will be highlighted as you drag.
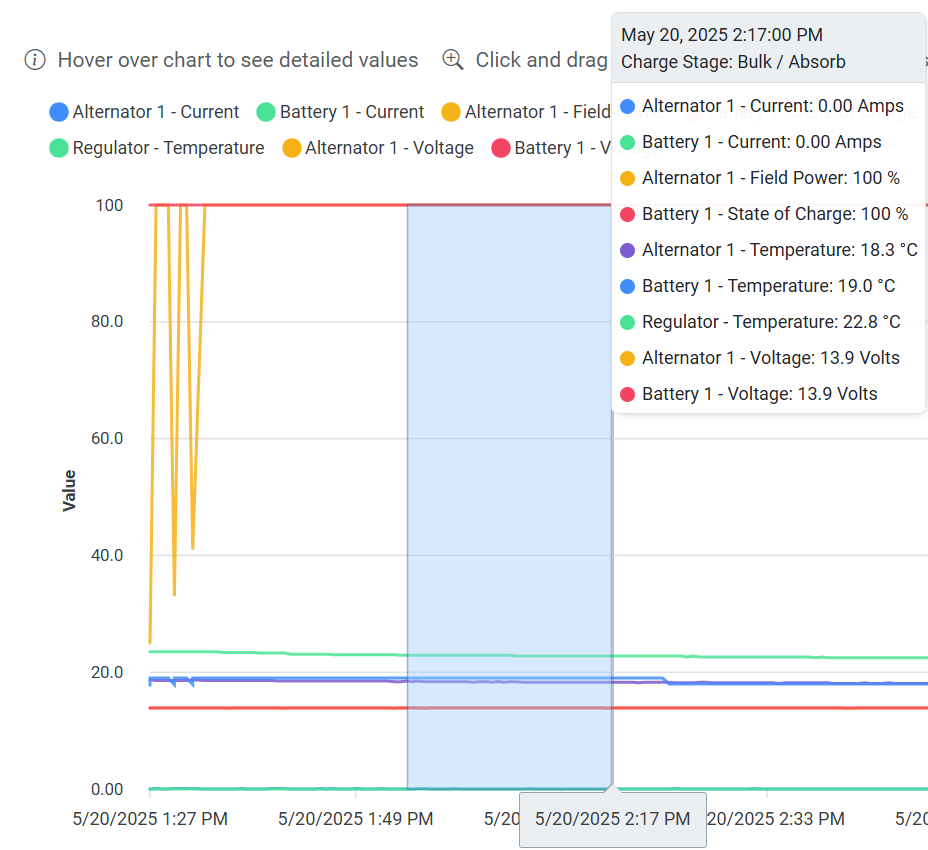
Click and drag to select a time period to zoom in on, or hover for detailed tooltips.
¶ Detailed Data Tabs
Below the main chart, several tabs provide more granular information and different perspectives on your data. Each tab typically includes a count of the items it contains (e.g., "Statistics 9", "Faults 2").
- Statistics Tab:
- Presents a table summarizing key statistical values – Minimum, Maximum, Average, and Range – for each selected device and measurement combination within the currently displayed time frame.
- Includes a "Download Stats" button to export this statistical summary as a CSV file.
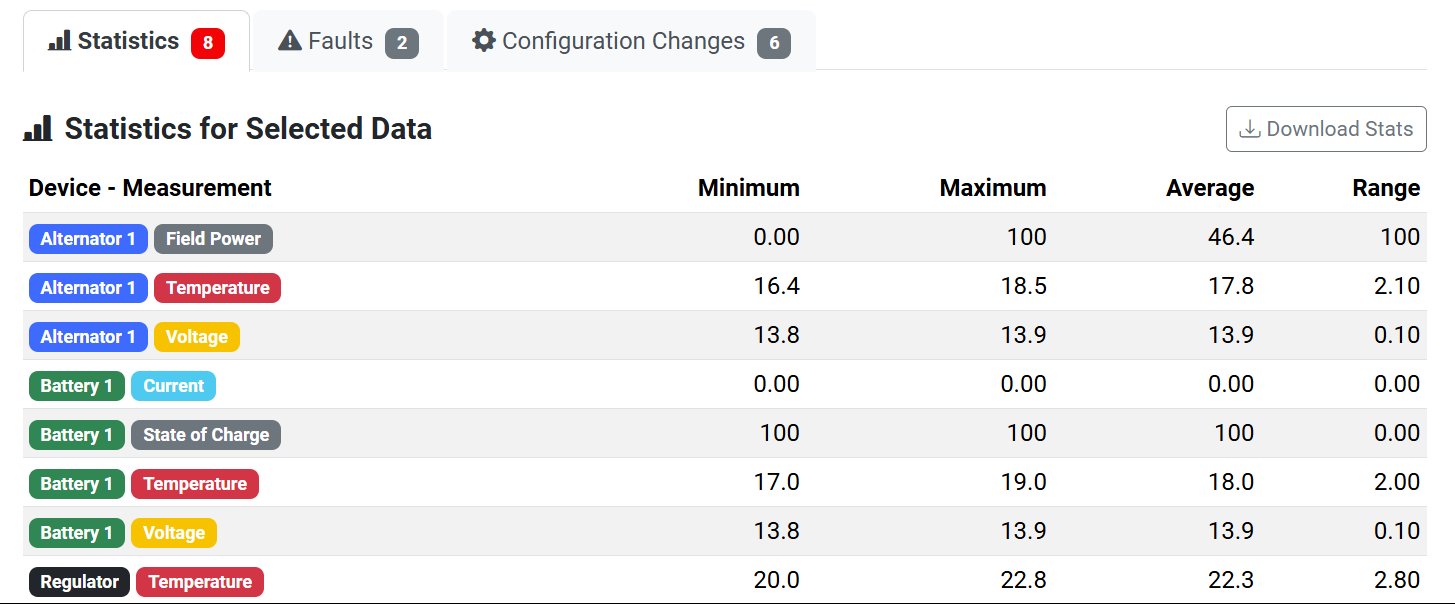
The Statistics tab provides a summary of min/max/avg/range for selected data.
- Faults Tab:
- Displays a log of any faults or alerts that have occurred. You can filter the displayed faults by Devices (e.g., "Alternator 1", "Battery 1") and Fault Types (e.g., "volts").
- The table lists the Time, Device, Fault Type, Description, and Value for each fault.
- Each fault entry has an Actions column with a "View Related Data" button, which takes you back to the chart focused on the time of that fault.
- A "Download All Faults" button allows for exporting the fault log.
- You can sort columns by clicking their headers and filter the entire table using the search bar. Pagination controls are available if there are many entries.
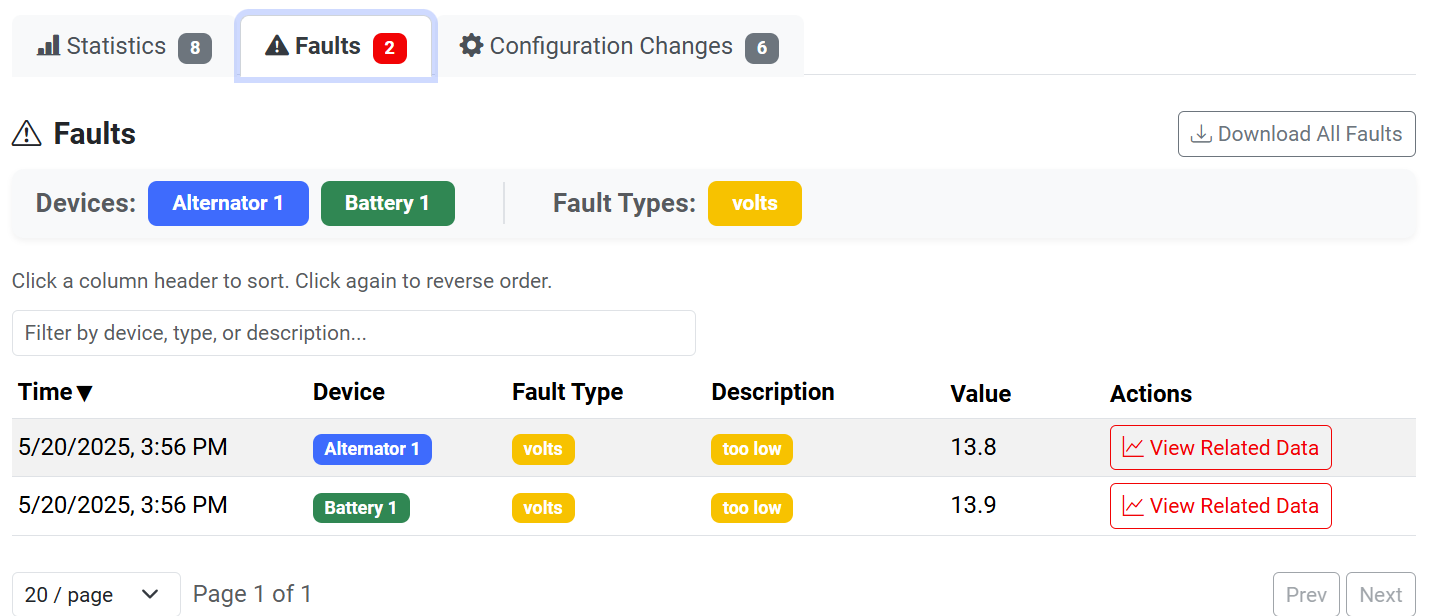
Review and filter historical system faults in the Faults tab.
- Configuration Changes Tab:
- Lists any changes made to the regulator's configuration settings over time.
- The table shows the Time of the change and a description of the Changes (e.g.,
cvVolts: "14.0" → "14.5"). - Each entry has an Actions column with "View Related Data" (to show chart data around the time of the change) and "Download" (to download specifics of that change event) buttons.
- You can sort columns by clicking their headers and filter the table using the search bar (e.g., "Filter by time or changed keys..."). Pagination controls are available.
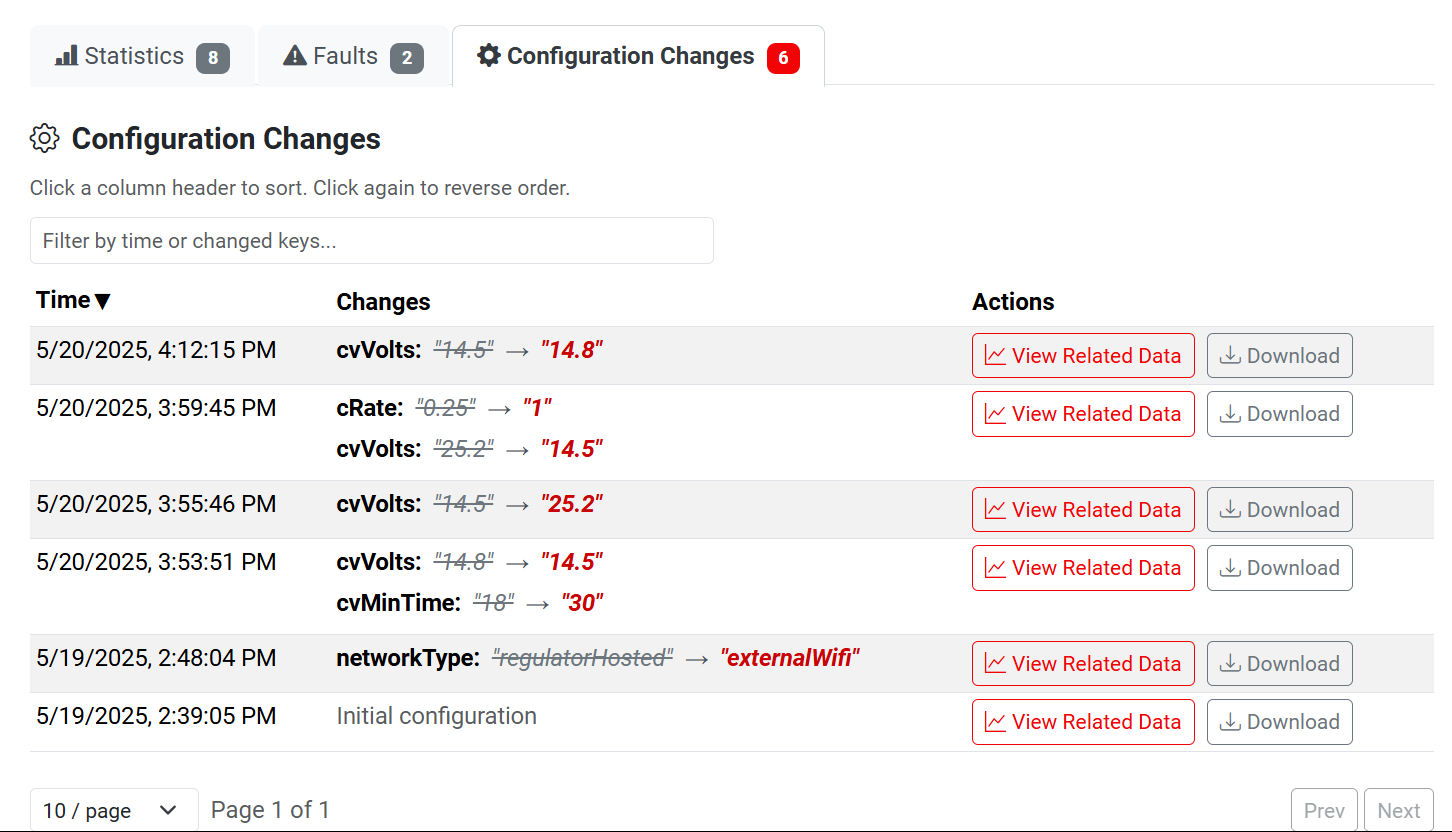
Track device settings modifications in the Configuration Changes tab.
¶ Tips for Using the Analysis Tool
- Start Broad, Then Narrow: Begin by selecting a wider "Time Range" (like "All time") and fewer measurements to get an overview. Then, use the zoom feature or refine your time range and add more specific measurements to investigate periods of interest.
- Correlate Data: Use the different tabs in conjunction. For example, if you see a fault in the "Faults" tab, use the "View Related Data" button or manually inspect the main chart around that time to see how other parameters (like voltage or temperature) were behaving. Similarly, check chart data around the time of a "Configuration Change."
- Regularly Review: Periodically checking the Analysis tool can help you proactively identify potential issues or optimize your system's performance.
Data Retention, Availability, and Timestamps:
The Analysis tool stores historical data locally on the Altion regulator. By default, this data is retained for 14 days. Data older than this retention period will be automatically purged to manage storage space.Understanding Timestamps: Your Altion regulator does not have its own internal clock that keeps track of the date and time when it's powered off. When it starts up, it tries to get the current date and time from the internet (if connected to Wi-Fi with internet access) or from other connected devices on your boat or RV's network (CAN bus).
- If it can get the current time, the data you see in the Analysis tool will have accurate timestamps.
- If it cannot get the current time from any source, the regulator will start its internal clock from a default fixed point in the past (January 1, 1970, known as the Unix epoch). Any new data recorded during this session will be added after any data that was already stored from previous sessions. This means that while the sequence of events and the duration between them will be correct for that session, the actual displayed dates and times might not match the real world clock if the regulator couldn't get an accurate time fix.
The specific devices, measurements, and data available within the Analysis tool will depend on your particular system setup, including connected sensors (e.g., temperature sensors, shunts) and how your regulator is configured. Refer to the installation instructions for information on compatible sensors and shunts.
This new Analysis tool provides a robust platform for understanding your charging system's behavior over time, empowering you with the data needed for effective management and troubleshooting.